What is a sample space diagram?
They are used to show all the outcomes of two events where the events are equally likely.
For example, you could use a sample space diagram when you roll dice, flip coins etc.
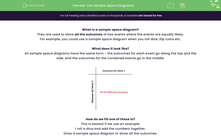
What does it look like?
All sample space diagrams have the same form - the outcomes for each event go along the top and the side, and the outcomes for the combined events go in the middle.
How do we fill one of these in?
This is easiest if we use an example:
I roll a dice and add the numbers together.
Draw a sample space diagram to show all the outcomes.
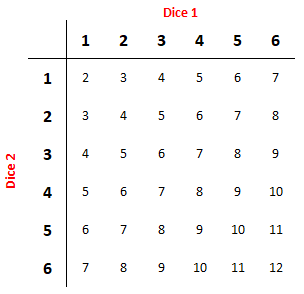
Step 1: Set up the outcomes for the individual events.
We know that on each dice we have the numbers 1 to 6.
Step 2: Fill in the middle.
I'll start with a random one - we are told that we add the numbers. If we roll two fours and add,
we will get 8.
We can now fill in the rest.
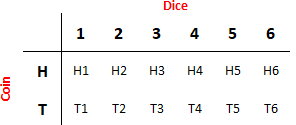
Will they always have numbers in the middle?
It depends on the question. For example, the outcomes of rolling a dice and flipping a coin can't be added together, so we just write both the outcomes.
Using a sample space diagram to find probabilities.
Example:
I roll two dice and add them together.
What is the chance that my numbers add to make a prime number?
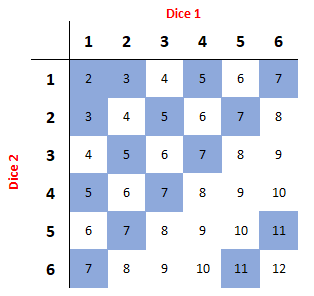
We already know that the sample space diagram looks like the one above. If we want to find the probability that my result is a prime, we count all the ones that are prime.
From this, we can count that we have 15 prime numbers.
We have 36 numbers in the middle section (we don't count the outside numbers).
This gives a probability of 15/36 which can cancel to 5/12
Now let's have a go at some questions.


.PNG)


