There are a number of ways to record multiple event probabilities: you can use probability trees, sample space diagrams or two-way tables.
This activity explores another type of diagram that can be used for recording the outcomes of two or more events - frequency trees.
Frequency trees are just used to classify information. Let's look at a couple to illustrate this point.
Example 1:
60 people are members of a gym. Of these, 45 are male.
Draw a frequency tree to show this information.
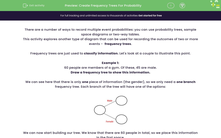
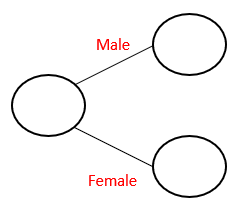
We can see here that there is only one piece of information (the gender), so we only need a one branch frequency tree. Each branch of the tree will have one of the options:
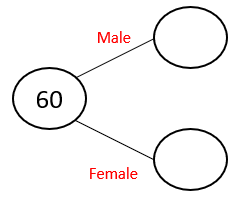
We can now start building our tree. We know that there are 60 people in total, so we place this information in the first space.
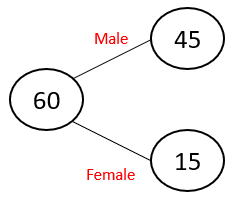
We also know that we have 45 males.
Which means we must have 15 females.
Example 2:
In a class of 32 students, 18 are boys of which 7 are left-handed.
There are 15 left-handed people in the class altogether.
If I pick a student at random, what is the probability that it is a right-handed girl?
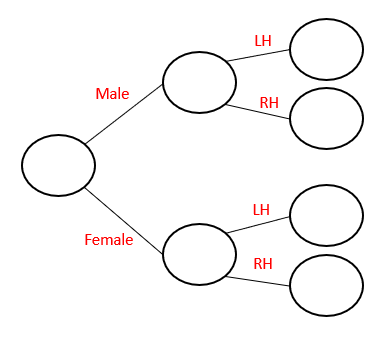
We can see that there are two options here - gender and left-handed/right-handed. This means that we need a two-level frequency tree:
Once we have the structure, we can start working out what goes where.
We have 32 students, if 18 are male, this means 14 must be female.
We are told that 7 of the boys are left-handed, so 11 of the boys must be right-handed.
We are also told that there are 15 left-handed people altogether. If 7 boys are left-handed, then 8 girls must also be left-handed.
This leaves us with 6 right-handed girls.
We can now finally answer our probability question.
We know we have 6 right-handed girls out of the 32 students, which gives a probability of:
|
= |
|
Let's have a go at some questions now.

