You may already have learn about how to solve equations using algebraic methods.
However, equations can also be solved using a graphical method, which is the method we will consider in this activity.
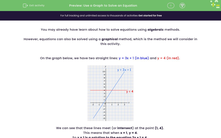
On the graph below, we have two straight lines: y = 3x + 1 (in blue) and y = 4 (in red).
.png)
We can see that these lines meet (or intersect) at the point (1, 4).
This means that when x = 1, y = 4.
So x = 1 is a solution to the equation 3x + 1 = 4.
We can add more horizontal lines to this graph and solve more related equations:
.png)
The green line has equation y = -2 and so where it intersects the blue line we have the solution to 3x + 1 = -2.
We see that the point of intersection is (-1 , -2) and so x = -1 is the solution to this equation.
Finally, the purple line has equation y = 8.
Where it intersects the blue line, we have the solution to the equation 3x + 1 = 8.
You will notice this time that the x-value is not a whole number, so we must estimate it.
It is approximately x = 2.3 so that is our best solution.
Note: We can check our solutions using the algebraic, balancing method:
3x + 1 = 8
3x + 1 - 1 = 8 - 1
3x = 7
3x ÷ 3 = 7 ÷ 3
x = 7/3 or 2.33333...
So we can be totally sure that we have the correct answer in the last question.
In this activity, we will find solutions to pairs of equations using graphs and finding where the lines intersect.
Graphs will be shown on your screen so don't forget to use your magnifier on the toolbar if you find them tricky to see at any point.


