When you are dealing with data, there is sometimes a need to exclude certain values.
If you were finding the average height of people in a reception class one day, you wouldn't include the teacher, as that would distort the data.
In maths, these are called outliers and there are two places you could meet them.
Scatter graphs
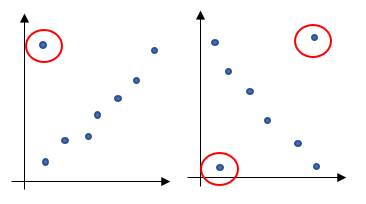
It is quite easy to spot outliers in a scatter graph, they're just the ones that don't fit into the pattern:
We can see that for these two scatter graphs, the points that are circled don't fit into the pattern of the rest - these would be outliers.
Frequency distributions
This is a bit more mathematical. There are other activities on how to find the interquartile range (IQR) and median of a distribution, so if you're not too sure about these, it would be a good idea to have a look at one of those before tackling these questions.
Outliers are defined as being:
Greater than the upper quartile (UQ) + 1.5 x IQR
Less than the lower quartile ( LQ) - 1.5 x IQR
Example:
A data set has a lower quartile of 20 and an upper quartile of 28.
Find the limits for the outliers.
Step 1: Find the IQR
IQR = UQ - LQ = 28 - 20 = 8
Step 2: Find 1.5 x IQR
1.5 x IQR = 1.5 x 8 = 12
Step 3: Find the limits for the outliers
UQ + 1.5 x IQR = 28 + 12 = 40
LQ - 1.5 x IQR = 20 - 12 = 8
This means that any numbers below 8 or above 40 in the distribution are outliers.
Question time!


