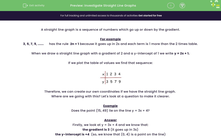
A straight line graph is a sequence of numbers which go up or down by the gradient.
For example
3, 5, 7, 9, ...... has the rule 2n + 1 because it goes up in 2s and each term is 1 more than the 2 times table.
When we draw a straight line graph with a gradient of 2 and a y-intercept of 1 we write y = 2x + 1.
If we plot the table of values we find that sequence:
Therefore, we can create our own coordinates if we have the straight line graph.
Where are we going with this? Let's look at a question to make it clearer.
Example
Does the point (15, 49) lie on the line y = 3x + 4?
Answer
Firstly, we look at y = 3x + 4 and we know that:
the gradient is 3 (it goes up in 3s)
the y-intercept is +4 (so, we know that (0, 4) is a point on the line)
If we take the point (15, 49) it means that when x = 15 then y = 49
If it lies on the line y = 3x + 4 we should be able to substitute these values in and the equation should be true!
If the equation is not equal then the point does not lie on the line!
Let's try some of these questions.


