In this activity, we will learn to answer questions by reading the information in pictogram tables.
Here is a pictogram.
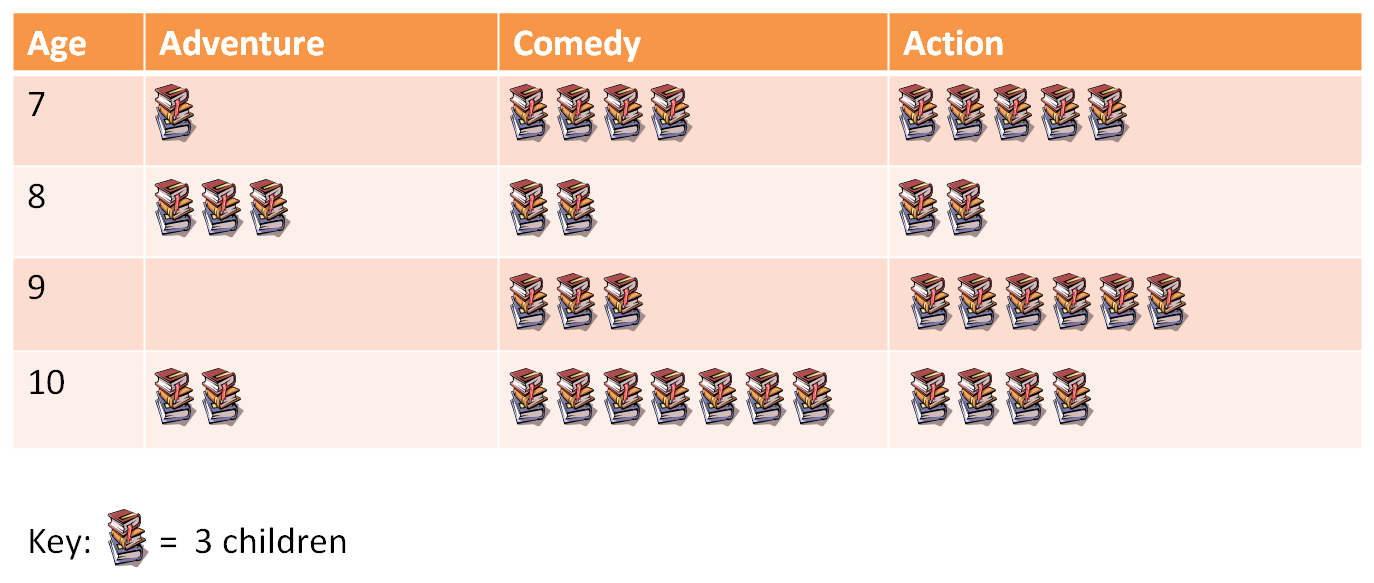
It shows the results of a survey in which children of different ages are asked about their favourite types of books.
The key shows us that one stack of books represents three children.

The pictogram shows that six of the ten year-olds chose adventure books, while twelve ten year-olds chose action books.
Let's try an example question together.
Example
Which is the most popular type of book for ten year-olds?
Answer
Looking carefully at the pictogram, we can see the following information:
6 ten year-olds prefer adventure books. (2 x 3 = 6)
21 ten year-olds prefer comedy books. (7 x 3 = 21)
12 ten year-olds prefer action books. (4 x 3 = 12)
So, the most popular type of book for ten year-olds is comedy.
Now you are ready to try some questions for yourself.


