At this level and to be successful in exams, you need to be able to illustrate inequalities.
When we have a single variable inequality (such as 2x + 1 > 7), we can find the solution set with a number line.
However, what do we do when we are using inequalities which contain two variables?
We use a set of axes.
When we draw inequalities on a number line, we use a shaded circle for greater than or equal to and an unshaded one for greater than.
When we are drawing on a set of axes, we have to change this slightly:
Greater than / Less than: We use a dashed line.
Greater than or equal to / Less than or equal to: We use a solid line.
Let's take a look at this in action.
e.g. Draw the inequality y > 3x + 1.
The first step here is to work out if we need to use a solid or a dashed line.
As the inequality uses a greater then sign, we need to use a dashed line to represent this graphically.
The next step is to work how the line would be positioned.
To do this, we ignore the inequality and draw the line y = 3x + 1 (using a dashed line of course!):
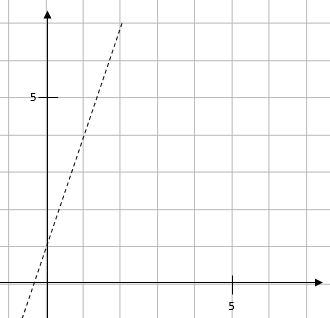
Once we have drawn this line, we need to decide which side to shade to illustrate the inequality.
To do this, we pick a point, plug this into the inequality and see if the point satisfies the inequality.
We think 0,0 is the best one to use but that's just our choice!
We know at (0, 0), x = 0 and y = 0:
y > 3x + 1
0 > 3(0) + 1
0 > 1
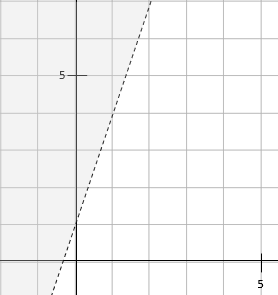
We can see very clearly that this is not true, so we shade above the line.
If it had been true, we would have shaded below.
Here is our final graph of this inequality:
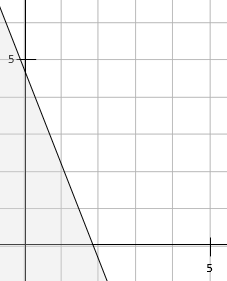
e.g. Draw the inequality 5x + 2y ≤ 10.
Once again, we pick our line type first.
As this sign is less than or equal to, we need to use a solid line:

Once again, we need to test to see which side we need to shade.
We're going to use (0, 0) again:
5x + 2y ≤ 10
5(0)+ 2(0) ≤ 10
0 ≤ 10
Because this statement is true, we know that this is the side of the line we need to shade, like this:
Let's try one more of a slightly different type.
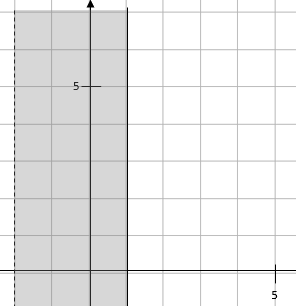
e.g. Draw the inequality -2 < x ≤ 1.
It is really common with this style of question that we have to draw single variable inequalities on a set of axes.
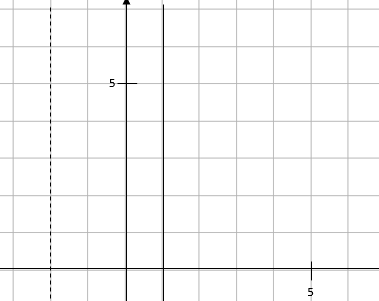
To draw this, we have to look at the inequality as two lines:
One line needs to be drawn at x = -2 and needs to be dashed (due to the use of the < sign).
The other line needs to be drawn at x = 1 and needs to be solid (due to the use of the ≤ sign).
If we draw this on a set of axes, we get:
We don’t need to test this one, as the inequality is already quite clear.
We are looking for the points between -2 and 1 so our shading on the graph needs to look this this:
In this activity, we will find the correct graphs to illustrate inequalities and solve problems using this information.
You will not have to draw any graphs yourself in this activity, but it is important that you understand the rules for doing so.
After you have completed the activity, you may want to go back through each question and practise drawing graphs for any inequalities which have not been graphically represented.

