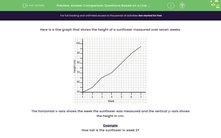
Here is a line graph that shows the height of a sunflower measured over seven weeks:
The horizontal x-axis shows the week the sunflower was measured and the vertical y-axis shows the height in cm.
Example
How tall is the sunflower in week 2?
Answer
55 cm
If we locate week 2 on the x-axis and follow it across to the y-axis, we can see that it is halfway between 50 and 60, which is 55 cm.

Ready to try some questions?


