When you have drawn a scatter graph, you need to be able to both state and interpret the correlation.
What is correlation?
Correlation is the connection between two variables eg. height and weight.
It is used do two things:
Say if there is a connection between two variables.
Describe how one variable affects the other.
What do the correlations look like?
There are three types of correlation:
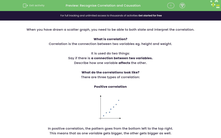
Positive correlation
In positive correlation, the pattern goes from the bottom left to the top right.
This means that as one variable gets bigger, the other gets bigger as well.
Negative correlation
In negative correlation, the pattern goes from the top left to the bottom right.
This means that as one variable gets bigger, the other gets smaller.
No correlation
When the points are scattered all over the graph, there isn't a pattern that links the two, so we say there is no correlation.
What is causation?
Causation is a bit trickier to get your head round - sometimes you just have to use common sense.
If you plotted a graph of height against weight, you would get a positive correlation. This is also causation because the two are linked - it makes sense to say that the taller you are, the more you weigh.
If however, you plotted the number of pirates in the world against the average global temperature, you would get a negative correlation. Does this mean that the more pirates there are in the world, the lower the temperature? Does it make sense that the two are linked?
This is an example of the fact that correlation does not imply causation.
Just because you have two things that appear to be linked, it doesn't always mean that one causes the other.
Time for some questions now.


 - 001.PNG)
 - 002.PNG)
 - 003.PNG)


