It quite often happens in a GCSE exam that you will be expected to deal with graphs that show real life situations.
In this activity, we will deal exclusively with reciprocal graphs.
What is a reciprocal graph?
A reciprocal graph is any graph that has the form f(x) = a/x or 1/x
This will give the graph that looks something like this:

Example:
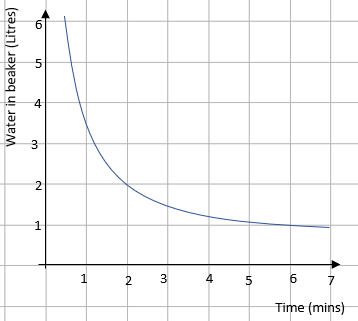
Water is poured out of a beaker.
The volume left in the beaker is plotted against time.

Describe the relationship between the time and the volume of water left in the beaker.
All this question is asking for is a statement about whether the volume is increasing or decreasing.
For this example, we can say that as time increases, the volume of water decreases.
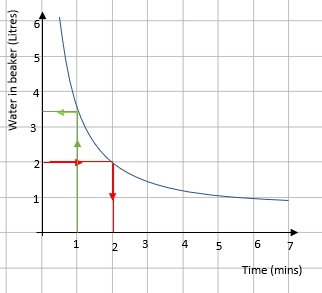
At what time is there 2 litres left in the beaker?
How much water is left in the beaker after 1 minute?
Both of these can be done by using the graph line to convert between the two values:

Reading from the graph, there are 2 litres left after 2 minutes and after 1 minute, there are approximately 3.5 litres left.
Time for some questions now.


