It quite often happens in a GCSE exam that you will be expected to deal with graphs that show real life situations.
In this activity, we will deal exclusively with exponential graphs.
What is an exponential graph?
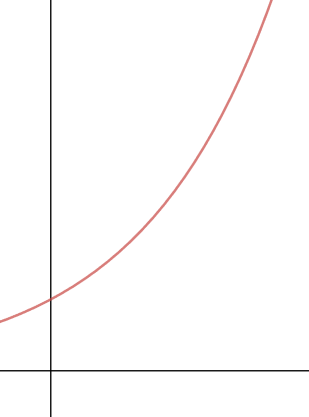
An exponential graph is any graph that has the form f(x) = ax
This will give the graph that looks like this:

Exponential growth means that as one variable increases, the rate of increase of the other also increases - try saying that three times fast!
Example:
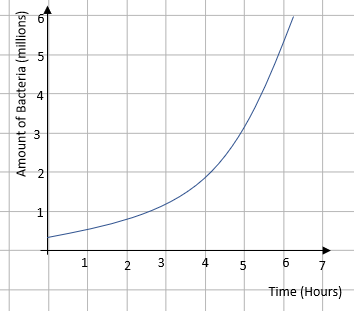
Bacteria are being grown in a dish and the results are recorded on a graph where the amount of bacteria is plotted against time:

Describe the relationship between the time and the amount of bacteria.
This question will always have the same response. When the graph is like this, the bacteria are growing exponentially.
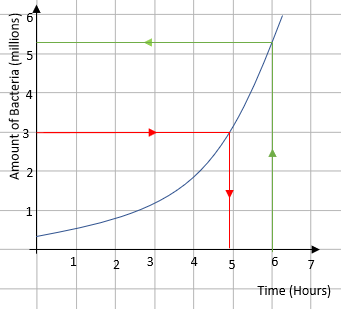
How long does it take to get to 3 million bacteria?
How many bacteria are in the dish after 6 hours?
Both of these can be done by using the graph line to convert between the two values:

Reading from the graph, there are 3 million bacteria after approximately 4.9 hours and after 6 hours, there are approximately 5.3 million bacteria.
Time for some questions.


