In this activity, we will learn about how to use the information shown in a simple bar chart to answer questions.
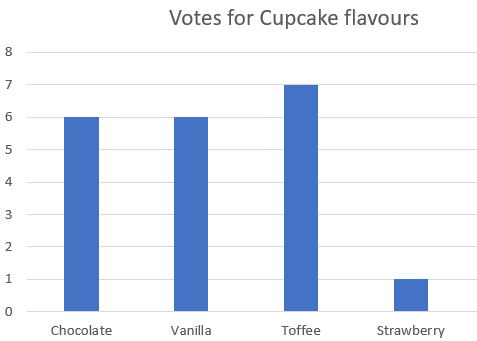
The bar chart below shows the result of a survey about cupcake flavours.

We can see that chocolate got six votes.
Strawberry was the least popular.
Let's try some example questions using the bar chart.
Example 1
How many people voted for vanilla?
Answer
To find the answer, we need to look very carefully at the bar chart.
The vanilla bar, goes up to the 6 on the scale on the left-hand side.
So, vanilla got 6 votes.

Let's try some questions now.


