Pie charts are an incredibly useful tool for displaying data. They are clear, concise, easy to read and almost universally understood.
When you are interpreting a pie chart, you have to understand that it doesn't show the actual amounts on the chart, it only shows proportions - whether they be fractions, decimals or percentages.
The only way you can work out how much each slice of the pie represents is if you are told what part of it (or the whole chart) represents.
Example 1:
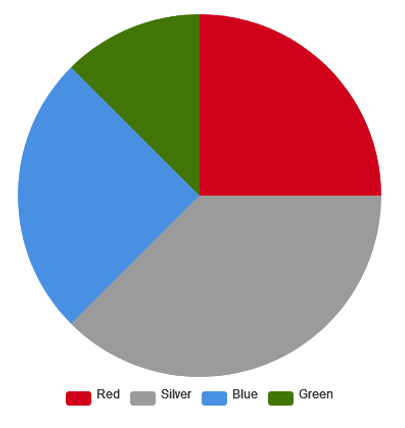
What proportion of this pie chart represents silver?
The good thing about this question is that, unless it's incredibly clear what proportion you have, you get a bit of leeway.
In this, silver is worth between 1/4 and 1/2 of the chart. This would be in the region of 3/8 of the chart (this could also be written as 37.5% or 0.375
Example 2:
A pie chart represents the colour of 40 cars.
How many were red?
We can see that red is exactly 1/4 (25%) of the chart, so we need to find what 1/4 of 40 is.
1/4 x 40 = 10 cars.
Time for some questions.


