Information can be presented to us in many different ways - words, pictures, numbers, diagrams etc.
In this activity, we're going to look at how to interpret information/data that is shown to us in a bar graph.
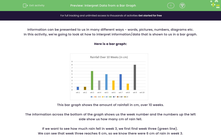
Here is a bar graph:
This bar graph shows the amount of rainfall in cm, over 10 weeks.
The information across the bottom of the graph shows us the week number and the numbers up the left side show us how many cm of rain fell.
If we want to see how much rain fell in week 3, we first find week three (green line).
We can see that week three reaches 6 cm, so we know there were 6 cm of rain in week 3.
Top tips:
Check the scale carefully, bar graphs do not always increase in increments of one.
The title of the bar graph tells us what information the graph is showing us.
Now it's your turn to answer some questions:


