When dealing with scatter diagrams, the questions in a GCSE paper follow a structure that is usually the same every year.
Draw the scatter graph.
Comment on the correlation/relationship.
Read the scatter graph.
Comment on the scatter graph.
In this activity, we're going to look at the last two.
Interpolation or extrapolation
The difference between these two words is actually quite simple.
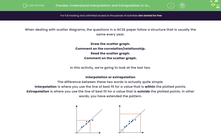
Interpolation is where you use the line of best fit for a value that is within the plotted points.
Extrapolation is where you use the line of best fit for a value that is outside the plotted points. In other words, you have extended the pattern.
The danger of extrapolation
When you are drawing a line of best fit, we draw a straight line through the points and use this to read values.
The problem here is that we don't actually know what happens outside the points we are given. How do we know that the graph doesn't take a sudden upwards turn? How do we know that it doesn't flatten out?
Because of this, we have to be very wary of using extrapolated values.
How would this be phrased in an exam?
A common way to phrase this would be along the lines of: 'James wants to use this scatter graph to predict the height of a man who weighs 100 kg. Explain why this could give a result that isn't accurate.'
The answer to this will always be: 'He is using a value outside the points that have been plotted.'
You don't even have to use the word extrapolated.
Let's give it a go!


