What do you remember about polygons?

The prefix 'poly' means many - so polygons are many-(straight-)sided shapes!
These include triangles, quadrilaterals, pentagons, hexagons etc.
So what could a frequency polygon mean?
We know frequency in statistics is how many times something occurred.
So a frequency polygon is a graph with many straight lines where the frequency is plotted against whatever type of data we collected.
.jpg)
Let's have a look at an example!
In a survey of 40 students, the number of hours spent on homework per week was recorded.
The data is summarised in the frequency table below:
| Hours (h) | Frequency |
|---|---|
| 0 ≤ h < 2 | 6 |
| 2 ≤ h < 4 | 13 |
| 4 ≤ h < 6 | 10 |
| 6 ≤ h < 8 | 8 |
| 8 ≤ h < 10 | 4 |
We want to construct a frequency polygon representing this data.
We can see from the first row that there were 6 students who spent between 0 and 2 hours on homework.
Since we will plot frequency against number of hours, the y-coordinate for this row will be 6.
But now, how could we represent an interval with a single x-coordinate?
We use the midpoint!
The number in the middle of 0 and 2 is:
(0 + 2) ÷ 2 = 1
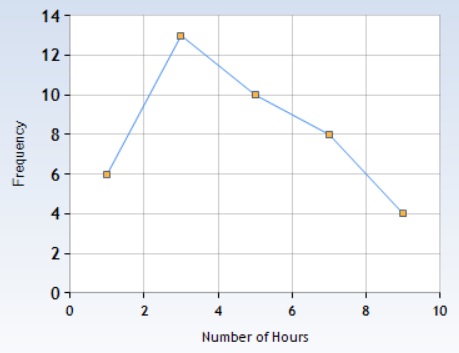
So the first row of the table will translate to a point (1, 6) in the graph.
Similarly, the midpoint for the second row is (2 + 4) ÷ 2 = 3 and the frequency for the class in the second row is 13.
So the second row gives the point (3, 13).
We get all the points in the same way, plot them and connect them with straight lines:

It's important that we do not extend the graph beyond the first and the last points since we don't have any data there!
Ready to have a go at some questions?!


