Do you know what your height is in centimetres?

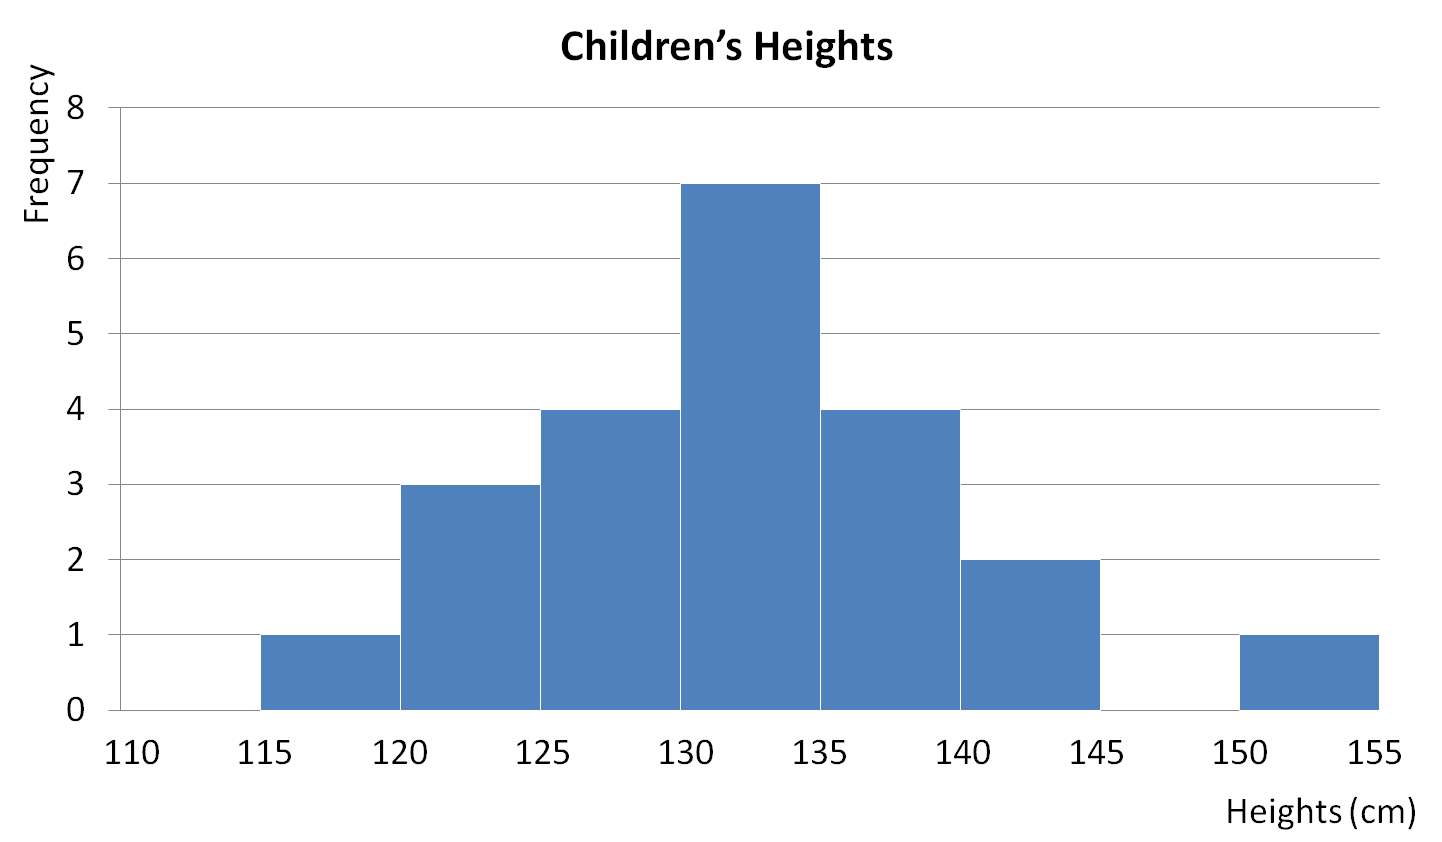
The following frequency chart shows the heights (in cm) of students in a Year 9 class:

We can use a frequency chart to work out our three averages: mean, median and mode!
Mean
We can only estimate the mean by using the midpoint value in each class.
These are 112.5, 117.5, 122.5, 127.5, 132.5, 137.5, 142.5, 147.5 and 152.5 cm
We multiply these midpoint values by the frequency that they occur. eg. 3 x 122.5 because three students are in that height group.
The estimated sum of all the heights is:
(1 x 117.5) + (3 x 122.5) + (4 x 127.5) + (7 x 132.5) + (4 x 137.5) + (2 x 142.5) + (1 x 152.5) = 2,910 cm
We add all the frequencies to find the number of students in the class:
1 + 3 + 4 + 7 + 4 + 2 + 1 = 22 students in total
The estimate for the mean height is therefore:
2,910 ÷ 22 = 132.3 cm (1 d.p.)
.jpg)
Median
We have found that there are 22 students in total.
So the 'middle person' will be the (22 + 1) ÷ 2 = 11.5th person, i.e. the value between the height of the 11th and 12th person.
The 11th and 12th people both fall into the 130 cm to 135 cm class.
So the median class is 130 cm to 135 cm.
Mode
This is the class with the highest frequency.
We can see that the tallest bar (i.e. the one with the highest frequency) is the one for 130 to 135 cm.
So the modal class is 130 cm to 135 cm.
Easy!
Grab your calculator and let's have a go at some questions!


