Do you like pies? Do you remember what they have got to do with maths?!
You might be thinking of the the infinitely long number pi = 3.14...
(Well done, that one is indeed very important to remember!)
Or you might be thinking of pie charts!
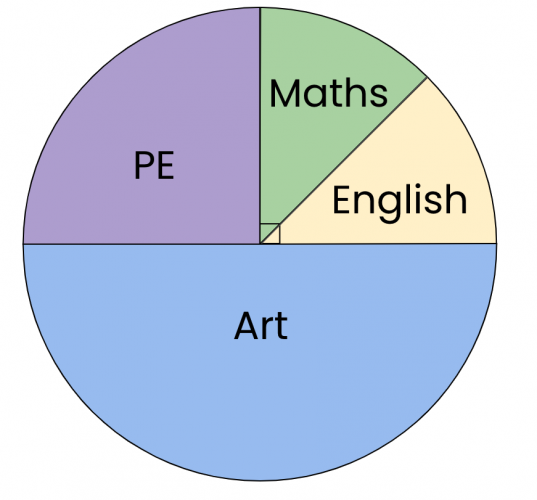
In this activity, we will revise how to find the angles of each slice from the data in order to construct a pie chart.
Let's have a look at an example:
Year 8 was surveyed to find out their favourite lunch choices.
The results were organised into a frequency table:
| Lunch Choice | Frequency |
|---|---|
| Pizza | 12 |
| Sandwiches | 8 |
| Pasta | 6 |
| Salad | 4 |
Altogether, we had 12 + 8 + 6 + 4 = 30 responses.
We can see that we got this by adding all the frequencies together.
We know the full turn angle of a circle is 360°.
That means 360° will need to represent the 30 students.
So we can write:
360° = 30 students
Dividing both of these figures by 30, we find that:
12° = 1 student
That means each student will occupy 12° of the pie chart!
| Lunch Choice | Frequency |
|---|---|
| Pizza | 12 |
| Sandwiches | 8 |
| Pasta | 6 |
| Salad | 4 |
If we then take sandwiches for example, the 8 students who chose them will be represented by a slice in the pie chart with an angle of 8 x 12° = 96°
(We call this the central angle for the response of sandwiches.)
We just multiplied the frequency with how many degrees correspond to 1 response!
Easy!
We can then find the other central angles in the same way and organise it neatly in the table by adding an extra column:
| Lunch Choice | Frequency | Central Angle |
|---|---|---|
| Pizza | 12 | 12 x 12° = 144° |
| Sandwiches | 8 | 8 x 12° = 96° |
| Pasta | 6 | 6 x 12° ° |
| Salad | 4 | 4 x 12° ° |
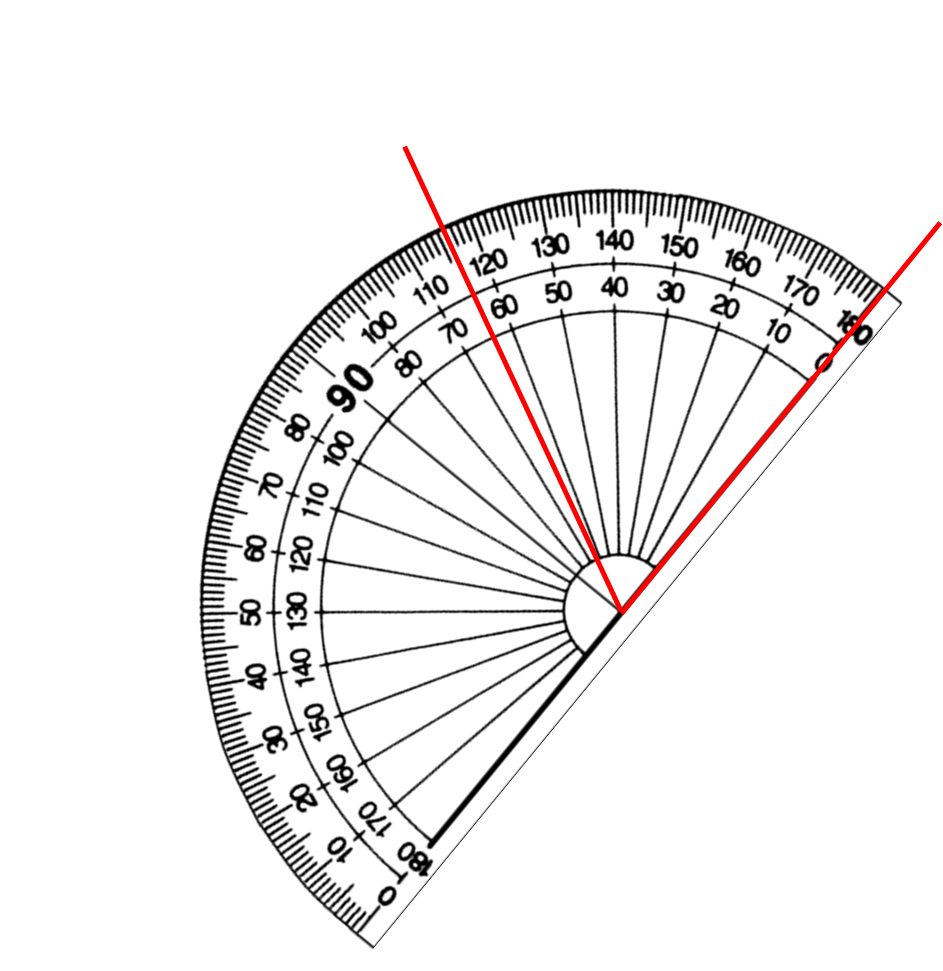
We would then use our protractors to construct all the angles and so the pie chart!
Let's have a go at some questions!

