Do you like sweets?

In a bag of sweets, there are 6 cherry sweets and 9 lemon sweets.
Two sweets are drawn at random.
How could we illustrate all the possible outcomes?
With a tree diagram!
A tree diagram is a diagram displaying the possible outcomes (and their respective probabilities) of a series of events.
It is particularly helpful for representing all the different scenarios, i.e. the different branches - just like in trees!
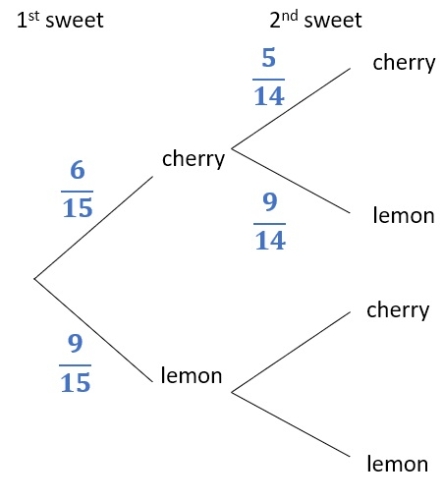
For example, in the above scenario we have the diagram branching out to the two flavours at each draw:

We know that there are 6 cherry sweets and 9 lemon sweets out of 6 + 9 = 15 sweets.
So the probability that the first sweet is cherry is 6/15 and that it is lemon is 9/15

But then for the second sweet we need to be careful because 1 sweet was already taken from the bag!
So if the first sweet was cherry:
- there are 6 - 1 = 5 cherry sweets left
- there are 15 - 1 = 14 sweets altogether
- there are still 9 lemon sweets (since picking the cherry sweet doesn't affect the number of lemon sweets)
The probabilities for the upper second branch are therefore:

We can verify we got this correct by seeing whether the branches coming from a single point add up to 1:
5/14 + 9/14 = 14/14 = 1
So that checks out!
.jpg)
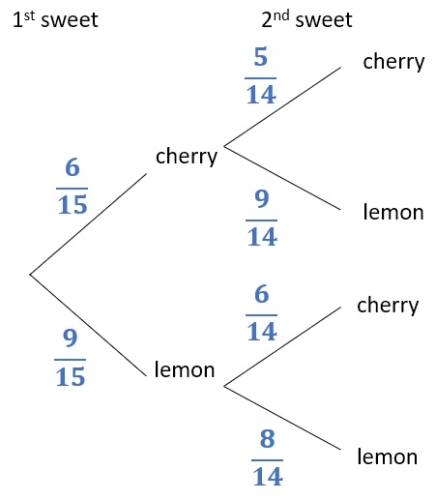
Now for the second sweet if the first sweet was lemon:
- there are 9 - 1 = 8 lemon sweets now
- 15 - 1 = 14 sweets altogether
- there are still 6 cherry sweets
So we get:

And that's it!
We can see that we could simplify some of the fractions, but generally we don't do that with tree diagrams as having the same denominator makes the calculations easier.
Ready to have a go at some questions?!


