What is a cumulative frequency diagram?
A cumulative frequency diagram is a method in statistics of taking a distribution (shown by frequencies) and making it into an ordered distribution, so that we can analyse it in detail.
What does cumulative frequency mean?
Cumulative comes from the same root word as accumulate, which means 'to build up'. Cumulative frequencies mean to 'build up the frequencies.'
Still puzzled?
When we are plotting cumulative frequency, instead of plotting the frequency for a single group, we plot all the frequencies up to that point.
If you're not still not too sure, have a look at this example.
Example:
Here are the marks for 50 students in a maths exam.
| Mark | Frequency |
| 21 - 30 | 1 |
| 31 - 40 | 6 |
| 41 - 50 | 6 |
| 51 - 60 | 8 |
| 61 - 70 | 8 |
| 71 - 80 | 6 |
| 81 - 90 | 7 |
| 91 - 100 | 6 |
| 101 - 110 | 1 |
| 111 - 120 | 1 |
If we wanted to find the cumulative frequency for the first row, it would just be the frequency for the first row.
If we wanted to find the cumulative frequency for the second row, we would add the frequencies from the first two rows.
If we wanted to find the cumulative frequency for the third row, we would add the frequencies from the first three rows etc.
This should give the following table:
| Mark | Frequency | Cum. Freq. |
| 21 - 30 | 1 | 1 |
| 31 - 40 | 6 | 7 |
| 41 - 50 | 6 | 13 |
| 51 - 60 | 8 | 21 |
| 61 - 70 | 8 | 29 |
| 71 - 80 | 6 | 35 |
| 81 - 90 | 7 | 42 |
| 91 - 100 | 6 | 48 |
| 101 - 110 | 1 | 49 |
| 111 - 120 | 1 | 50 |
How do we plot this?
The first step is to draw the axes if you haven't already been given them - you will usually be given them in an exam.
For any diagram that involves frequency (bar graphs, line graphs, cumulative frequency, histograms), we always plot the frequency up the side and the other scale (in this case, marks) along the bottom.
Once, we have the axes, we are ready to plot our points.
This is where most of the mistakes are made when drawing a cumulative frequency diagram.
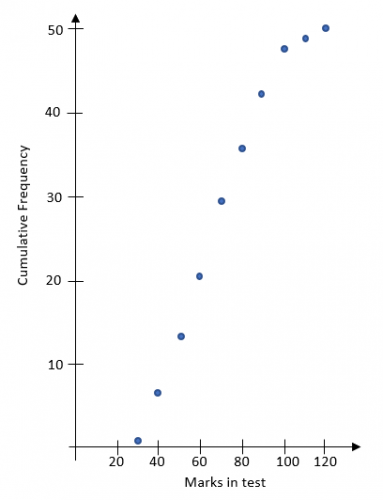
We plot the cumulative frequency against the upper bound of the group:
| Mark | Cum Freq | Point to plot |
| 21 - 30 | 1 | (30,1) |
| 31 - 40 | 7 | (40,7) |
| 41 - 50 | 13 | (50,13) |
| 51 - 60 | 21 | (60,21) |
| 61 - 70 | 29 | (70,29) |
| 71 - 80 | 35 | (80,35) |
| 81 - 90 | 42 | (90,42) |
| 91 - 100 | 48 | (100,48) |
| 101 - 110 | 49 | (110,49) |
| 111 - 120 | 50 | (120,50) |
Plotting these points will give:
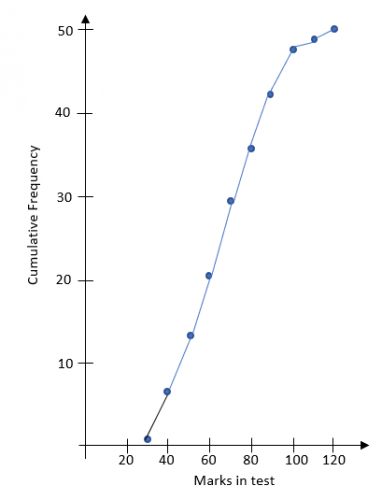
Lastly, we have to draw a line to join these up.
Do not try to join them up with a curve - it's difficult and you don't get any extra marks for a curve.
Just join them up with a straight line, point to point.
Why isn't the first point joined to the axes?
Technically, you don't know what is happening before that first point. There are some times when you do and sometimes when you don't.
An examiner will be expecting you not to, so just leave it out.
The Shape
If you look at this graph, you will notice it has a very distinctive shape - it gets steeper, then shallower and doesn't come back down.
All cumulative frequency diagrams will have this shape.
Let's have a go at some questions now.


