It is often quite useful to be able to visualise a journey in maths. One of the ways of doing this is to use a distance-time graph.
What is a distance-time graph?
A distance-time graph is a graph that has time along the bottom (the x-axis) and distance up the side (the y-axis).

There are a number of bits of information that we can find from this graph:
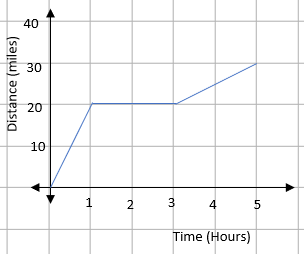
The flat bits – The section in this graph between 1 and 3 hours is completely flat. This means that time is increasing but distance is not, so flat parts indicate when something has stopped.
The diagonal parts – For the diagonals, we can see that distance and time are changing. If you think about it, the gradient of the diagonal is the distance ÷ the time.
distance ÷ time = speed
The gradient of the diagonal parts of the distance-time graph give the speed.
The steeper the line, the faster the object is moving.
Example 1:
John leaves home at 9 am and walks three miles to James’ house in 2 hours. He stays there for an hour and then gets the bus back.
The bus travels at an average speed of 6 miles per hour.
Draw a distance-time graph for this information.
For this, we need to look at each stage of the question.
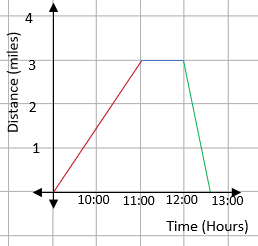
John leaves home at 9 am and walks three miles to James’ house in 2 hours.
From this, we know that there will be a straight line that starts at 9 am, goes up to a distance of 3 miles and a time of 09:00 + 2 = 11:00.
He stays there for an hour
The words stays there indicates that he has stopped, so this will be drawn as a flat line for 1 hour.
and then gets the bus back. The bus travels at an average speed of 6 miles per hour.
We know that if he is going back, the straight line will go back to zero, but we don’t know the time.
If the bus travels 6 miles in 1 hour, it will cover the 3 miles back in 30 minutes.
We can then put all this onto a distance-time graph:

What time does John arrive home?
This can just be read from the distance-time graph. He arrives home when the distance is back at zero which is 12:30.
The time travelling lift
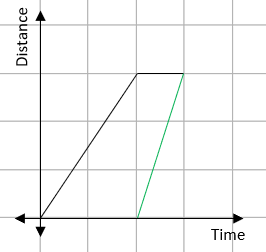
Unfortunately, sometimes people get confused and produce distance-time graphs that look a bit like this one:

This example was about someone travelling up a building in a lift, stopping for a while and then coming back down.
The issue here is with the line highlighted in green. In this, the lift leaves the top of the building and travels down, but appears to arrive before it left!
While this is an amusing story, it also is a really important point. In distance-time graphs, the lines can never go backwards as this is travelling back in time - they must always go forward!
Let's try some questions now.


