A conversion graph is exactly what it says: a graph that is used to convert between two values.
You might be familiar with this concept from your work on scatter graphs, where the line of best fit can be used to convert between two connected values.
How to read a conversion graph
Example:
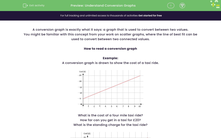
A conversion graph is drawn to show the cost of a taxi ride.

What is the cost of a four mile taxi ride?
How far can you get in a taxi for £20?
What is the standing charge for the taxi ride?

If we read the values off the graph:
A four mile taxi ride costs £13.
£20 will get you 7.5 miles.
The standing charge is the cost before you move. This is £5.
How much would a 15 mile journey cost?
This is a bit more tricky because it’s off the chart. Unfortunately, you can’t just find the cost of a five mile trip and multiply it by three. The standing charge gets in the way.
To solve this, you need to split the two sections.
To get 5 miles costs £15, but £5 of that is the standing charge, so to travel 5 miles actually costs £10.
This means that a 15 mile trip costs 3 x 5 = £30.
Add the standing charge back on and you get £35.
Now let's have a go at some questions.


