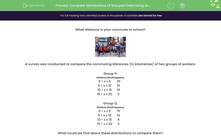
What distance is your commute to school?

A survey was conducted to compare the commuting distances (in kilometres) of two groups of workers:
Group P:
| Distance (km) | Frequency |
|---|---|
| 0 < x ≤ 5 | 20 |
| 5 < x ≤ 10 | 15 |
| 10 < x ≤ 15 | 10 |
| 15 < x ≤ 20 | 5 |
Group Q:
| Distance (km) | Frequency |
|---|---|
| 0 < x ≤ 5 | 15 |
| 5 < x ≤ 10 | 10 |
| 10 < x ≤ 15 | 8 |
| 15 < x ≤ 20 | 3 |
What could we find about these distributions to compare them?

Our averages!
For grouped data, we get the mean by adding the products of the frequencies and midpoints of intervals and dividing by the sum of frequencies:
Mean of group P:
20 x 2.5 + 15 x 7.5 + 10 x 12.5 + 5 x 17.5 = 375
20 + 15 + 10 + 5 = 50
375 ÷ 50 = 7.5
Mean of group Q:
15 x 2.5 + 10 x 7.5 + 8 x 12.5 + 3 x 17.5 = 265
15 + 10 + 8 + 3 = 36
265 ÷ 36 = 7.36
So we can see that the commuting distance per worker is less in group Q.
We can also find the median class by finding what position it should be on:
Group P has 20 + 15 + 10 + 5 = 50 workers, so the median should be on the (50 + 1) ÷ 2 = 25.5th position.
That falls into the second class of 5 < x ≤ 10 so that is the median class.
Group Q has 15 + 10 + 8 + 3 = 36 workers, so the median should be on the (36 + 1) ÷ 2 = 18.5th position.
That falls into the second class of 5 < x ≤ 10 so that is the median class.
So both groups have the same median class.
This means that half of the workers in each group have a commute time of between 5-10 minutes or less.
.jpg)
We can also find the modal class by looking at which class has the highest frequency in each group:
Group P's highest frequency is 20 which corresponds to the 0 < x ≤ 5 class, so that is the modal class here.
Group Q's highest frequency is 15 which corresponds to the 0 < x ≤ 5 class, so that is the modal class here.
We can see that both have the same modal class.
So we can see that the most frequent distance to travel for both groups is between 0 and 5 km - so a rather short commute!
.jpg)
Let's have a go at some questions!


