We use experiments in science regularly, to test ideas and look for patterns in the results. In this activity, we are going to discuss how we could calculate speed using the results of an experiment.
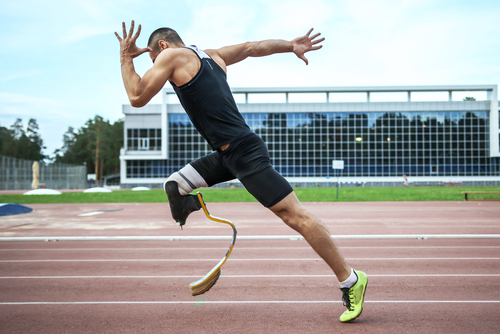
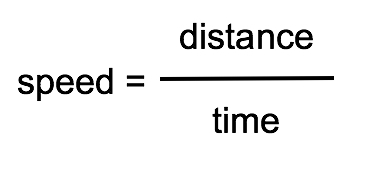
Let's start by making sure we know how to calculate speed. We can use this equation to calculate it:
The standard units we use in science are the following:
Speed is measured in metres per second (m/s)
Distance is measured in metres
Time is measured in seconds
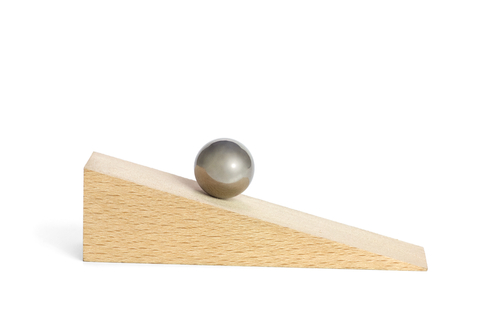
We are going to imagine an experiment where we investigate the average speed of a ball rolling down a slope.
Our hypothesis is: 'The height of the slope will affect the average speed of the ball'.
First, we need to decide what our variables are. In experiments, there is an independent variable and a dependent variable. Do you know what these are?

In an experiment, the independent variable is whatever you change, to see if it affects the outcome.
The dependent variable is what you measure, and it depends on the independent variable.
So what are the variables in this experiment?
The independent variable is the height of the ramp.
The dependent variable is the speed of the ball.

The next step in our experiment is to decide what equipment we need. It's particularly important to know what measuring equipment we will need.
As well as the ball, the ramp, and something we can use to vary its height, we also need equipment to measure the height of the ramp.
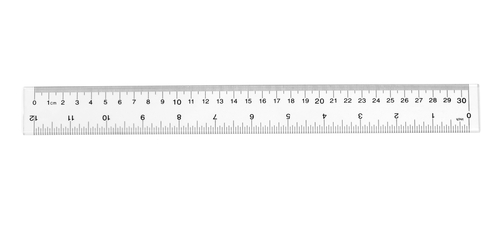
Let's use a ruler to measure the height of the ramp.
It's quite difficult to measure the speed of a ball directly. So, instead, let's measure the distance the ball travels along the ramp, and the time it takes to reach the bottom of the ramp!
Once we have that data we can use the speed equation to calculate the speed!
We can use the ruler again to measure the distance, and we can use a stopwatch or timer to measure the time.
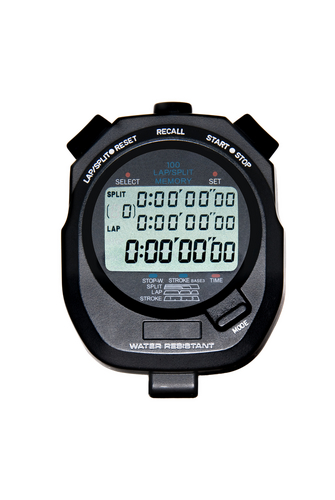
Now we need a table for our results! Let's include one here.
| Height of Ramp (m) | Distance Ball Travels (m) | Time (s) | Speed (m/s) |
| 0.1 | 1.5 | 1.29 | |
| 0.2 | 1.5 | 1.22 | |
| 0.3 | 1.5 | 1.04 | |
| 0.4 | 1.5 | 0.97 | |
| 0.5 | 1.5 | 0.85 |
These are some example results. Next, we need to use the data to calculate the speed of the ball! Let's do the first one as an example, and we will round our answer to two decimal places.
Speed = Distance ÷ Time
Speed of the ball = 1.5 m ÷ 1.29 s = 1.16 m/s
Here are the rest of the results:
| Height of Ramp (m) | Distance Ball Travels (m) | Time (s) | Speed (m/s) |
| 0.1 | 1.5 | 1.29 | 1.16 |
| 0.2 | 1.5 | 1.22 | 1.23 |
| 0.3 | 1.5 | 1.04 | 1.44 |
| 0.4 | 1.5 | 0.97 | 1.55 |
| 0.5 | 1.5 | 0.85 | 1.76 |
As we can see, our hypothesis was correct. The height of the ramp did affect the speed of the ball. The greater the height of the ramp, the greater the speed of the ball.
We can say that this experiment was a fair test. This is because only the independent variable, the height of the ramp, affected the dependent variable, the speed. Everything else was kept constant (like the distance the ball travelled down the ramp because we used the same ramp each time).
Now let's see if we can apply what we have learnt in some practice questions!

