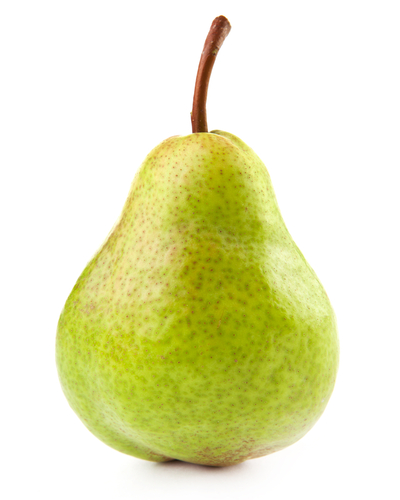
Do you like pears?

A farmer took a sample of 11 pears and measured their weights in order to compare this year's produce to last year's:
140, 153, 154, 155, 155, 157, 158, 158, 159, 160, 177
We can see that there are a couple of outliers: 140 and 177 are significantly different from most of the data.
What could be a useful measure to use in such a scenario?
We could use quartiles to see what the middle 50% of the data is between!
Let's recall that quartiles divide the data into quarters:
1st quartile (Q1) = 25th percentile, i.e. value that 25% (one quarter) of the data are smaller or equal to
2nd quartile (Q2) = 50th percentile, i.e. value that 50% (two quarters) of the data are smaller or equal to - so it is the middle value, i.e. the median
3rd quartile (Q3) = 75th percentile, i.e. value that 75% (three quarters) of the data are smaller or equal to
We can find all quartiles quite easily using the median.
Median is the middle value and we can find it either by:
1) Crossing one number from each side at a time (when the numbers are in an ascending order) until we reach the middle number:
140, 153, 154, 155, 155, 157, 158, 158, 159, 160, 177
or
2) Finding the position of the median by adding 1 to the total number of numbers and dividing by 2:
There are 11 numbers so the median is the (11 + 1) ÷ 2 = 6th number, i.e. 157!
The median divides the data into two halves:
140, 153, 154, 155, 155, 157, 158, 158, 159, 160, 177
Since the lower quartile (Q1) is one quarter of the way through the data, it is the median of the lower half:
140, 153, 154, 155, 155, 157, 158, 158, 159, 160, 177
And indeed, if we wanted to verify through the position, we can see Q1 would be the (11 + 1) ÷ 4 = 3rd number =, i.e. the 154 we found!
Similarly, the upper quartile is at the 3 x (11 + 1) ÷ 4 = 9th number (because it's three quarters of the way through the data), i.e. the median of the upper half:
140, 153, 154, 155, 155, 157, 158, 158, 159, 160, 177
So we can the middle 50% of the data lies between 154 (Q1) and 159 (Q3)!
We can use these to find the interquartile range (IQR), i.e. the distance over which the middle 50% of the data is spread out:
IQR = Q3 - Q1 = 159 - 154 = 5
So the middle 50% of the data is spread out over the distance of 5!

This is not an easy topic to get your head round, so don't worry if this all seems a bit daunting.
Let's work through some questions together and you can always look back at this introduction by clicking on the red help button that will appear on the screen as you start the questions.


