In this activity, we are going to explore the use of tree diagrams for finding the probability of a series of events.

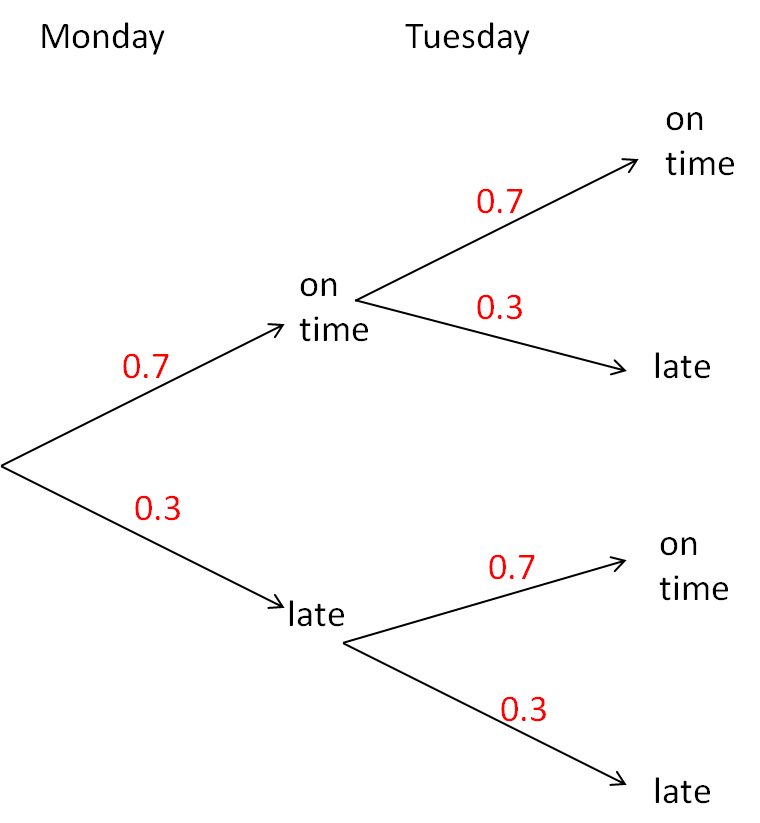
Given the following tree diagram, how could we find the probability that a bus is late on both days?

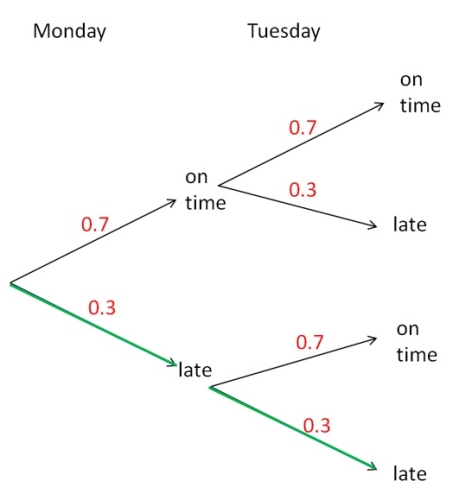
We want the probability that the bus is late on Monday and on Tuesday, i.e. the probability of the green path below:

Anytime we are finding the probability of something 'and' something happening or the probability on the same path on the tree diagram, we multiply the probabilities:
P(late and late) = 0.3 x 0.3 = 0.09
Let's say we now wanted to find the probability that the bus is late on exactly one day.
We have two possible paths to achieve such a scenario:

The orange path gives us:
P(on time and late) = 0.7 x 0.3 = 0.21
The green path gives us:
P(late and on time) = 0.3 x 0.7 = 0.21
We want the probability that the bus is late on exactly one day, i.e either on time on Monday and late on Tuesday (orange path) or late on Monday and on time on Tuesday (green path).
Anytime we are finding the probability of something 'or' something happening or the probability of different paths on the tree diagram, we add the probabilities:
P(late on one day) = P(on time and late) + P(late and on time) = 0.21 + 0.21 = 0.42
In this example, the orange and green paths' probabilities were the same - be careful because this will not always happen, we just had a scenario where it did!

Ready to put this all into practice?


